|
The Drawbridge
by James Gerrard
Freedom, Security and Wealth
|
Hi {{ subscriber.first_name | strip | default: "Reader" }}
About The Drawbridge
James Gerrard, $200m of Assets Under Management, prestigious Property Week Award winner, London School of Economics, "Highly Commended" Cambridge University achieved success by identifying macro trends early and positioning his firm to ride them.
James lost his home as a teenager after his Dad's industry was wiped out by the internet boom and mortgage payments became unaffordable. James built the metaphor of The Drawbridge as a framework to explain macro trends and help people avoid being stuck on the wrong side of the rising bridge. James' firm partners with some of the most experienced investors on the planet building real estate strategies. The goal here is to democratise that knowledge for everyone. There's not a wealth gap, there's a knowledge gap.
|
|
The Drawbridge | May 2026
Important Trends
From James: Whilst unemployment is trending upwards, the trend paused this month. Rents continue to rise, as do wages, and while house prices are stagnating nominally they continue to fall once adjusted for inflation. The trend is a strong housing market concealed by a higher interest-rate environment. Higher rents (5Y +32.9%) drive people to buy, increased wages (5Y +29.3%) allow people to borrow more, and houses are 10.1% cheaper in real terms, improving affordability. So why is the housing market not skyrocketing? Mortgage approvals are down 21.6%, meaning the higher-rate environment is keeping a lid on a boiling kettle.
MoM points to the sales market being reignited, but the Iran War has snuffed that out. The trend will continue for the next few years: inflation increasing nominal house prices while real house-price growth declines, with pressure building once rates do fall.
Disclaimer
This content is provided for general information and educational purposes only. It does not constitute financial, investment or legal advice. You should seek independent professional advice before making any financial decisions.
Data checked 01 May 2026; sources: ONS, UKHPI, Bank of England, Freightos, GOV.UK, and James Gerrard affordability model.
|
Demand Metrics
Nominal House Prices
£290,001
Average sale price in England.
| ↑ 5Y +15.4% |
| ↑ YoY +0.3% |
| ↑ MoM +0.2% |
Why it matters: Price trends drive equity growth and seller confidence.
|
Real House Price
£206,996
Average England price in 2015 CPI-adjusted pounds.
| ↓ 5Y -10.1% |
| ↓ YoY -2.2% |
| ↓ MoM -0.2% |
Why it matters: Stripping out CPI shows whether housing is really gaining or losing purchasing power.
|
Rent (Eng)
£1,434
Typical monthly private rent.
| ↑ 5Y +32.9% |
| ↑ YoY +3.5% |
| ↑ MoM +0.3% |
Why it matters: Rent levels shape yields and tenant affordability.
|
Price-to-Income
8.06
House price multiple of income.
| ↓ 5Y -10.8% |
| ↓ YoY -2.9% |
| ↑ MoM +0.1% |
Why it matters: Lower multiples improve access for first-time buyers.
|
Payment-to-Income
0.43
Mortgage payment share of income.
| ↑ 5Y +13.8% |
| ↓ YoY -6.5% |
| ↑ MoM +0.7% |
Why it matters: Lower burdens support demand and borrowing capacity.
|
Average Salaries
£35,984
Average annualised regular pay (UK).
| ↑ 5Y +29.3% |
| ↑ YoY +3.3% |
| ↑ MoM +0.1% |
Why it matters: Income growth underpins mortgage affordability.
|
Unemployment
4.9%
Unemployment rate (ILO, 16+).
| ↓ 5Y -2.0% |
| ↑ YoY +11.4% |
| ↓ MoM -5.8% |
Why it matters: Jobs anchor demand.
|
Sales Volumes
45,094
Monthly transactions.
| ↓ 5Y -47.4% |
| ↓ YoY -28.8% |
| ↑ MoM +0.3% |
Why it matters: Volume signals liquidity and market momentum.
|
Mortgage Approvals
63,531
Approvals for house purchase.
| ↓ 5Y -21.6% |
| ↓ YoY -0.8% |
| ↑ MoM +1.3% |
Why it matters: Approvals are an early read on purchase demand and mortgage credit availability.
|
3 Takeaways / 30 Seconds
This month: A strong housing market is concealed by higher rates: rents and wages are up, nominal prices are stagnating, real prices are down, and approvals remain suppressed.
Implication: House prices are becoming more affordable for buyers because inflation and wage growth are reducing real prices.
Watch next: Real price decline, mortgage pricing, approvals, rent momentum, and whether the Iran War keeps the sales bounce on hold.
Explanation of Data
Rent (England) - £1,434
5Y +32.9% Rents are stabilising near term, but demand has kept outrunning supply.
YoY +3.5% The Renter's Rights Bill is an artificial upward pressure on rents.
MoM +0.3% The latest move points to stabilisation, not reversal. Price-to-Income - 8.06 (House prices relative to average earnings)
5Y -10.8% This is an affordability adjustment for buyers as incomes beat prices.
YoY -2.9% The adjustment is still edging forward.
MoM +0.1% The short-term trend remains a little easier for buyers. Pay-to-Income - 0.43 (Share of income spent on mortgage payments)
5Y +13.8% A larger share of income is still needed under post-Iran War mortgage pricing.
YoY -6.5% Wage growth has offset some of the rate pressure.
MoM +0.7% Monthly affordability remains sensitive to rate moves. Average Salaries - £35,984
5Y +29.3% Income growth has rebuilt borrowing power.
YoY +3.3% Pay is still supporting demand.
MoM +0.1% The monthly trend remains steady. Unemployment - 4.9%
5Y -2.0% The labour market has held up overall.
YoY +11.4% Whilst unemployment is trending upwards, the trend paused this month.
MoM -5.8% The monthly labour read can be volatile. Sales Volumes - 45,094 transactions
5Y -47.4% Activity is still far below old norms.
YoY -30.8% Liquidity remains very weak.
MoM +0.3% The short-term bounce was cut short by the Iran War.
Deep Insight
The market looks frozen, but in reality it is down c.10% over five years in real terms while up c.15% nominally. This is very similar to the mid-1970s, when nominal prices rose c.30% but real house prices declined c.30%. This happens in high-inflation environments with high interest rates. The price of things increases but people's buying power declines. They have more pounds in their bank account, but in real terms they are poorer. House-price-to-income ratios are improving, so housing is becoming more affordable for buyers. Once rates reduce, house prices can accelerate higher both nominally and in real terms.
|
Supply Metrics
Build Cost Index
Materials & Labor
Index (2015=100)
What changed: Housing new-work build costs rose 3.6% year over year and remain above 2021 levels.
Why it matters: Higher build costs squeeze feasibility and slow new supply without price growth.
|
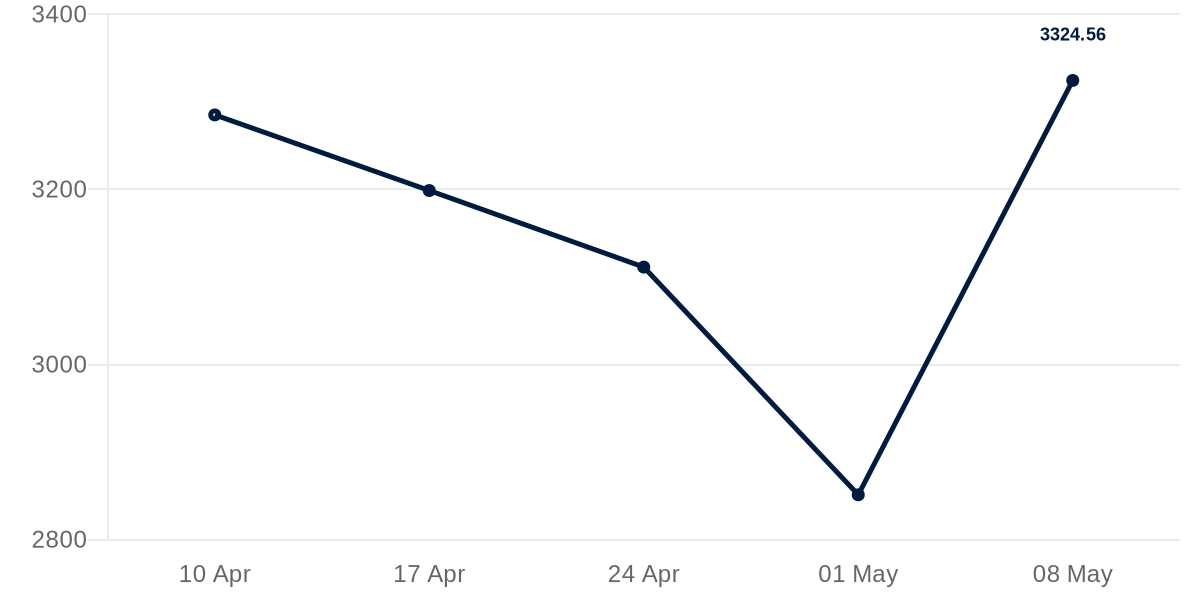
Freightos Baltic Index (FBX11)
Asia to North Europe
USD per FEU
What changed: Freightos Baltic rates into North Europe rose 16.6% from the prior published point. The Europe-facing lane remains volatile into early May.
Why it matters: Imported-material landed costs react faster to route disruption, bunker fuel, and war-risk surcharges than the old volume proxy.
|
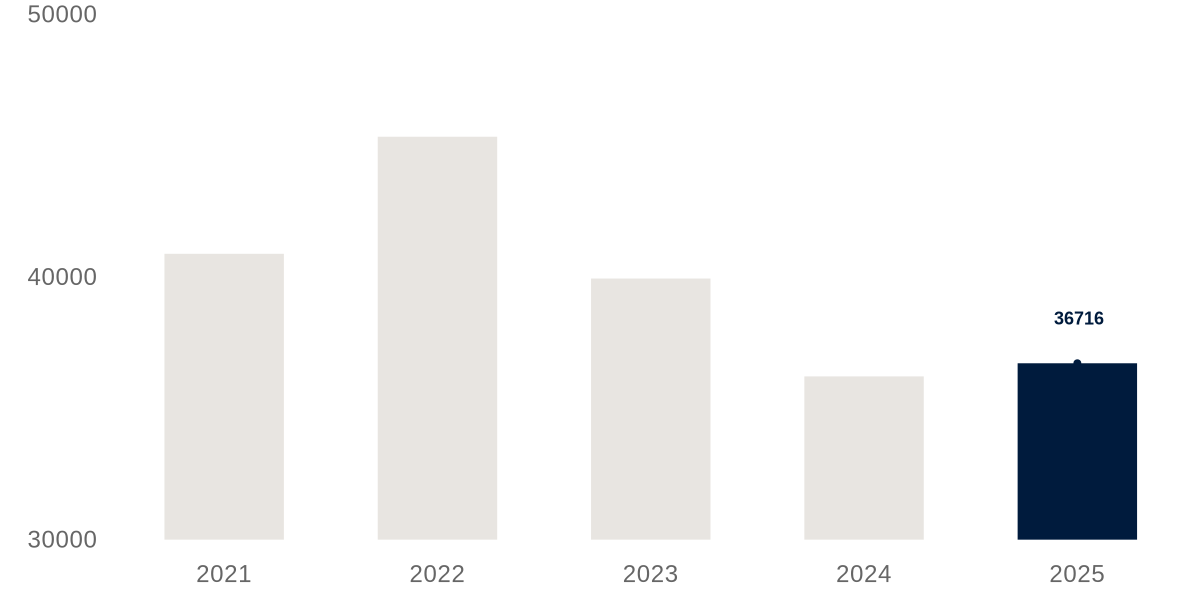
New Build Completions
Units Delivered
Units
What changed: Completions rose 1.4% year over year and remain below 2021 levels.
Why it matters: Lower completions tighten availability and can keep price pressure on.
|
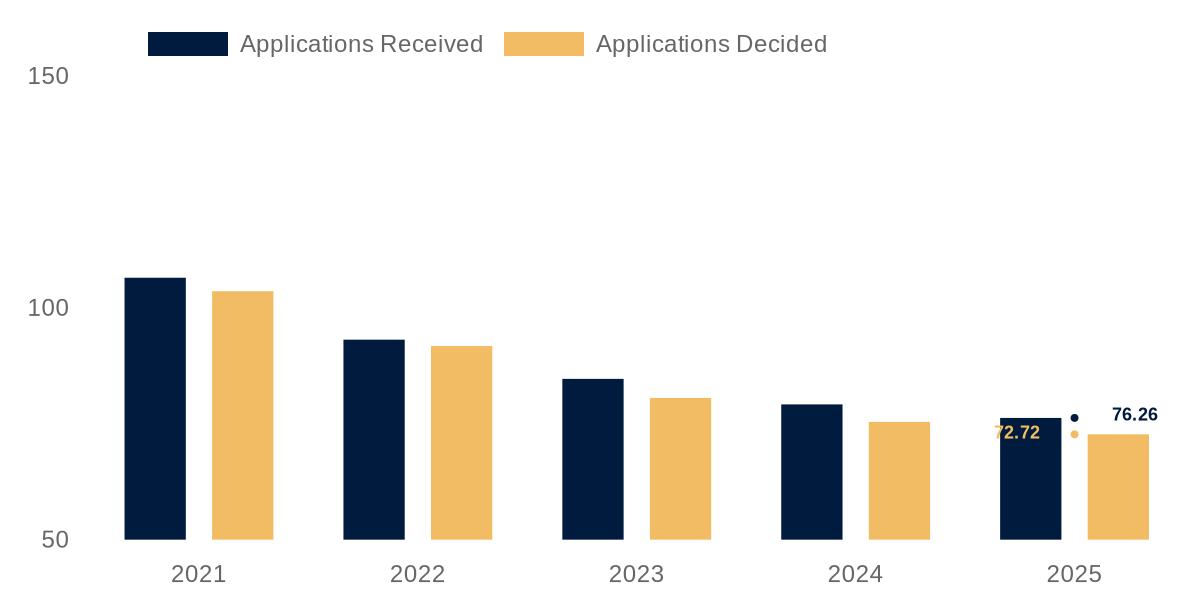
Planning Permissions
Approvals Pipeline
Applications
What changed: Applications received fell 3.7% year over year; decisions fell 3.6% year over year and remain below 2021 levels.
Why it matters: A weaker approvals pipeline limits future supply even if demand improves.
|
|
Supply Outlook
Supply remains the real bottleneck. Build costs remain high and planning plus completions are still too weak to release the pressure. Mortgage rates are likely to fall before housing supply materially increases, which could create a sharp house-price spike. |
|
Inflation & Debt
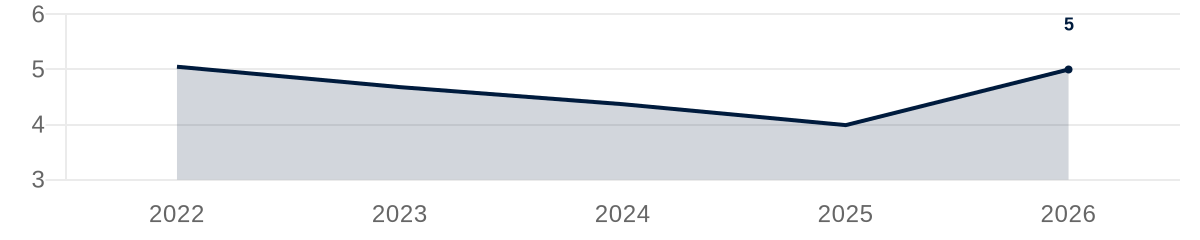
Mortgage Rate 2yr
Fixed Rate (2Y)
Rate (%)
What changed: 2-year fixes rose 0.72pp year over year, and rose 0.69pp from the prior month and remain above 2021 levels.
Why it matters: Short-term pricing drives refinancing activity and entry-level affordability.
|
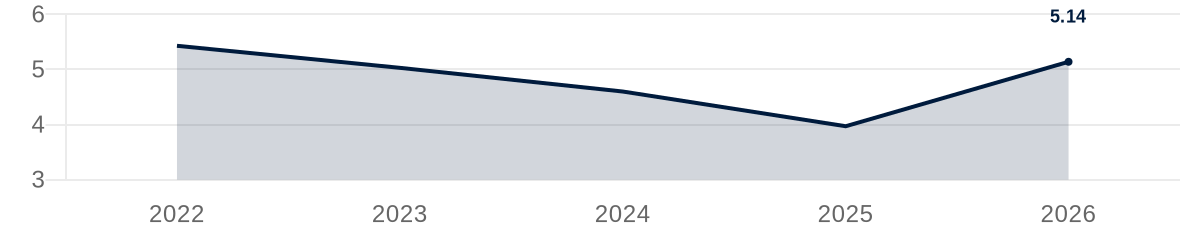
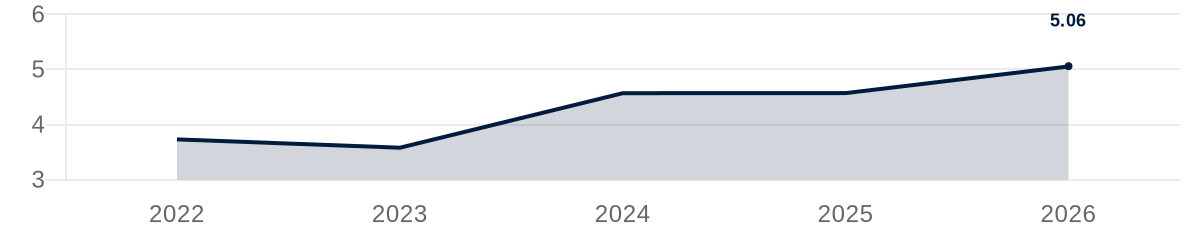
Mortgage Rate 5yr
Fixed Rate (5Y)
Rate (%)
What changed: 5-year fixes rose 0.71pp year over year, and rose 0.57pp from the prior month and remain above 2021 levels.
Why it matters: Longer fixes anchor underwriting assumptions and debt service.
|
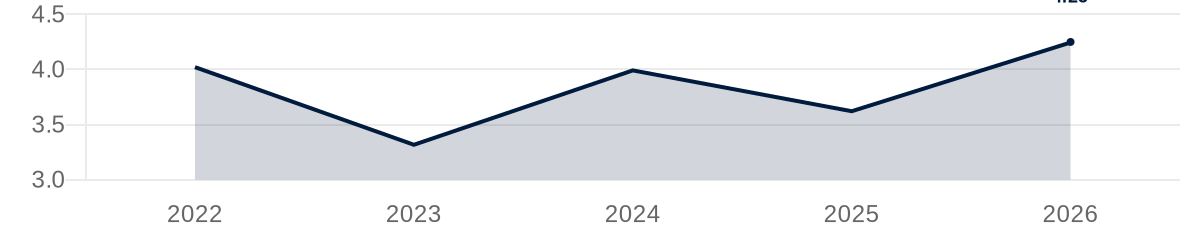
Gilt Yields 10yr
UK Gov 10Y
Yield (%)
What changed: 10-year yields rose 0.60pp year over year, and rose 0.11pp from the prior month and remain above 2021 levels.
Why it matters: Benchmark yields influence funding costs, which feed into swap and mortgage pricing.
|
SWAP Rates
5Y GBP Swap
Rate (%)
What changed: 5-year swap rates rose 0.67pp year over year, and rose 0.14pp from the prior month and remain above 2021 levels.
Why it matters: Swap pricing feeds directly into fixed-rate mortgage offers.
|
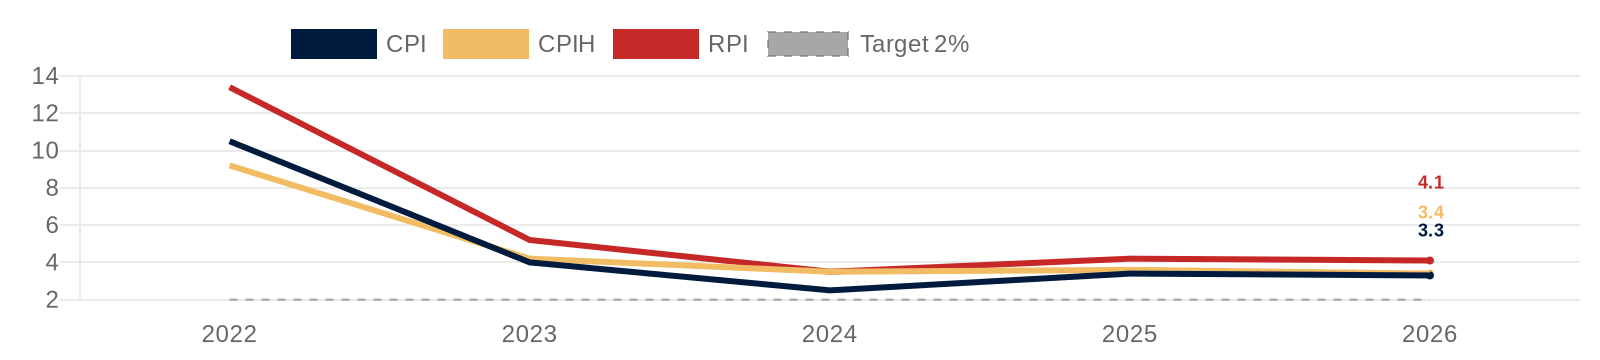
CPI vs RPI vs CPIH
UK Inflation Measures
12-month rate (%)
What changed: CPI, CPIH, and RPI remain above the 2% target at 3.3%, 3.4%, and 4.1% respectively.
Why it matters: Sticky inflation keeps rates higher for longer and pressures affordability.
|
|
Need help with mortgage, development, bridging or other financing?
|
|
Rate Takeaway / 30 Seconds
Rates are higher again, and interest rates are unlikely to fall to a level that lifts house prices until 2029/30.
|
|
|
Macro Regime
The shock phase is fading, but this still looks like a structurally higher-rate market than 2010-2021. Mortgage and swap rates are still below the 2022/23 shock peak, but recent rate moves, CPI 3.3%, CPIH 3.4%, RPI 4.1%, and elevated gilts still keep funding tight. More mortgage funding now comes from capital markets, so gilt pricing matters more for mortgage pricing than it used to. |
|
|
Executive Summary
In 2022 we wrote to investors explaining that house prices would track a 1970s scenario rather than a 2008 crash. We were right and our partners have profited hugely. The real estate market is going through a 'silent crash': whilst house prices are growing, they are not exceeding inflation. With the Iran War this is set to continue over the next few years. Underneath this, though, are strong growth signals waiting for the right interest-rate environment. Our firm is prioritising: 1) distressed assets; 2) high-yielding PRS in secondary markets (10%+); and 3) very selective prime Central London assets. |
Political P.S.
The Iran War is unlikely to reach any conclusion until the US midterms in Q4 2026. Try not to think about this as when will the region return to 'normality' but understanding this is a fundamental break from the past and a new 'balance of power' is emerging in the region. Energy prices will remain elevated, inflation will rise, and mortgage rates will stay elevated from 2025. The UK local elections have now confirmed the erosion of the centre. Labour suffered heavy losses, the Conservatives also weakened and Reform turned protest momentum into real council control. Note the shared, long term ambitions of both Labour and Conservative to abolish Stamp Duty, there is unusual bipartisan agreement here. Whilst the Conservatives took further losses the party does seem to be rebuilding itself with Kemi Badenoch also having the highest approval rating vs any other political leader. Starmer has survived the immediate pressure, a big call, but I personally expect him to hold on and him to see through any leadership challenge to its conclusion. The domestic instability will see gilt yields remain elevated putting a floor to mortgage rates. Both these geopolitical and domestic challenges will create a period of further instability till at least 2029/2030 putting upward pressure on UK and personal borrowing costs. |
Share Feedback
Tell us what we should improve on. Reply to this email with your suggestions.
|
Important Notice
The information contained in this newsletter is for general information and educational purposes only and should not be relied upon as financial, investment, tax or legal advice. Whilst every effort has been made to ensure accuracy, no representation or warranty, express or implied, is made as to its completeness or accuracy.
All views expressed are those of the author at the time of writing and are subject to change. Market conditions, economic data and forecasts may evolve, and past performance or trends are not reliable indicators of future outcomes.
Before making any investment or financial decision, you should seek advice from a qualified and regulated professional adviser who can take into account your individual circumstances.
© The Drawbridge Media Ltd. All rights reserved. This newsletter is published by The Drawbridge Media Ltd, the special purpose vehicle (SPV) publishing entity for The Drawbridge.
|